[GNUPLOT] Hide axis range
Posted on March 8, 2012, 5:54 PM
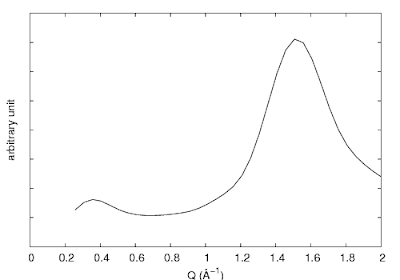
In gnuplot, a handy way to turn off the axis is to use:
unset ytics |
set ytics ("" -40, "" -30, "" -20, "" -10, "" 0, "ten" 10, "twenty" 20, "thrity" 30, "" 40, "" 50, "" 60) |
![](https://blogger.googleusercontent.com/img/b/R29vZ2xl/AVvXsEg4BeXzD-wgm7_6ehqE-lCKiYLBi3GxQt2NZFfCt5-kezJdStwHlhAF9nFRlHIbnmKCwj9FfnfmHRDaG2YtSdJso8CmKdp6xtIkrbfFKqti7twXNz_ZjDUju8z1C6flviY1VGlDMeBTqlc/s400/test.png)
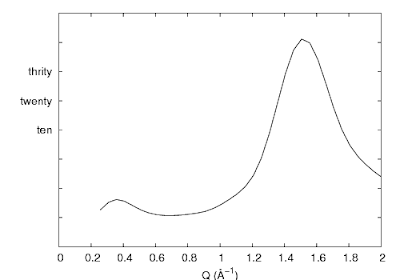
So utilizing this command, we could hide all the labels by removing the text inside the double quotes. Or, a much simpler way is to use set format:
set format y "" |
![](https://blogger.googleusercontent.com/img/b/R29vZ2xl/AVvXsEhUJJtBYn0mQS3GkA4IvFRnRMw4QoKR9Wri-apgpw-pyemdVarTkWTueT4vOUUeRM2reyyBrgxQ2CDf2Ui5wbr2yUchGnCXyImmdNhdcUD_uy4McBHjQqURiBM5ZjtzmBmvKivU67gs3Ds/s400/test.png)