[LAMMPS] Read/Observe Log File

Although we could always write our own scripts to process LAMMPS output files, LAMMPS has this awesome package, Pizza.py , which already contains many powerful tools to allow quick observations on the simulation results.

At the beginning of a simulation, you might want to check how energies and temperature drift, get averages over blocks of trajectory, and visualize the fluctuation of the simulation box. All these information can be retrieved in the log file, and all we need is the Pizza.py toolkit. Since the whole package is a combination of Python scripts, we also need to have Python installed.

Download the Pizza.py toolkit from this page , and put it in your directory. After unzipping it, you could find the Python script pizza.py in the src folder. The Pizza.py toolkit can be used directly or interactively.

First set up an alias pointing to where you put the pizza.py file. For example:
$   alias pizza='python -i /home/pizza/src/pizza.py
Then run pizza.py by typing in
$   pizza
This will bring you into the pizza.py interactive interface:
Pizza.py (9 Feb 2012), a toolkit written in Python
type ? for help, CTRL-D to quit
Loading tools ...
>

There might be some error messages after Loading tools if you don't have some of the modules required. Don't worry if you are missing some modules. Not every function uses all the modules.

Here I want to demonstrate how to use the interactive interface to observe the thermo output in LAMMPS log file.
>  l=log("*log")
180000000 182500000 185000000 187500000 190000000 192500000
read 6001 log entries
This function will read in the files that have names end with log. This command calls the log.py script in the src folder. It can take multiple files, single files, even incomplete files. Check the comments in log.py to get more information.

After reading in the thermo info stored in *log, we can get individual items. For example, to get timestep, pressure, temperature, energy:
s,t,p,E=l.get("Step","Temp","Press","TotEng")
Variables on the left hand side can just be any variables. The items inside the right hand parenthesis have to match with their names in the *log files.

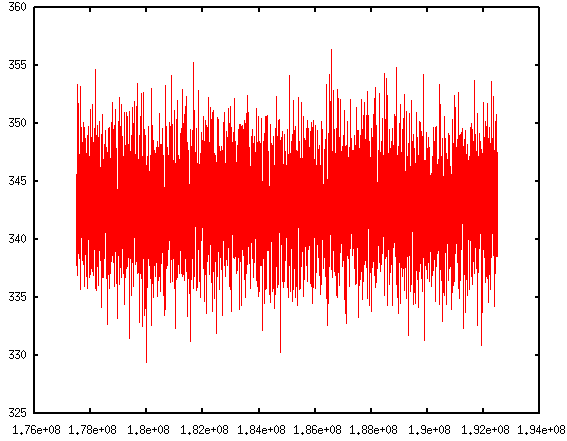
The thermo information fluctuates a lot. A better way to look at them is to plot against time. In the Pizza.py toolkit, they incorporate Gnuplot (in gnu.py) so that we can directly use it in the interactive interface:
> g=gnu()
> g.plot(s,t)

The first command calls Gnuplot and the second command will plot timesteps vs. temperature.

If you are like me, impatient of typing in those commands repetitively, don't worry. Pizza.py toolkit can also take scripts. There is a collection of scripts written by Pizza.py users. They come within the Pizza.py package. These scripts are handy to use and are very powerful. It allows me to do block averages in just one line.

Read more:
Block average
Visualizing log files

[GNUPLOT] Hide axis range

In gnuplot, a handy way to turn off the axis is to use:
unset ytics
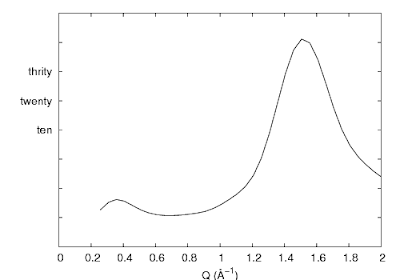
This will remove all the tics and associated labels on the y axis. Sometimes we like to have the tics there, but hide just the numbers (i.e. when using arbitrary unit). A more complicated way is to use the set ytics ("〈label〉" 〈position〉,) command. This is used for assigning specific labels at given positions.
set ytics ("" -40, "" -30, "" -20, "" -10, "" 0, "ten" 10, "twenty" 20, "thrity" 30, "" 40, "" 50, "" 60)

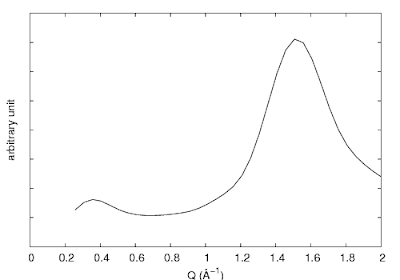
So utilizing this command, we could hide all the labels by removing the text inside the double quotes. Or, a much simpler way is to use set format:
set format y ""
Leave the double quotes empty will remove all the labels but keep the tics there.

Gnuplot with script

Gnuplot is a software in Linux machine that let you plot and fit your data.  It has an interactive interface, or if you prefer, you can plot data with a script.

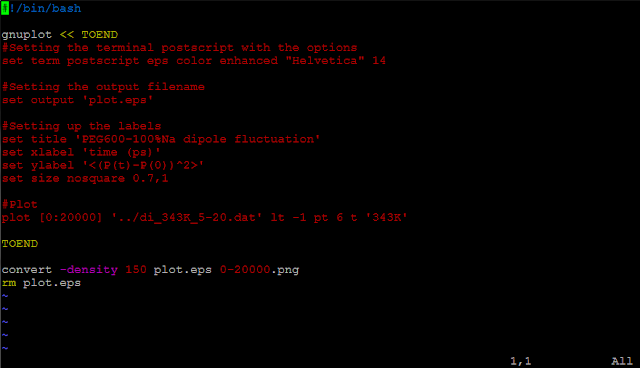
Here's an example of a script that plot a file in postscript, and convert it into png file: The communication with gnuplot is enclosed by the two "TOEND". In side the TOEND, type in all the commands that you'd like gnuplot to do for you. If you'd like to use linux command to manipulate your data, i.e. awk, you'll have to add "\" when you use the "$" sign. For example if I want to make the x values 1000 times smaller :
   plot "<awk '{print \$1/1000, \$2}' input_file"

Otherwise, if you only have "$1", the compiler will think it is the variable of the script itself.

After create the image in postscript format, the convert command (ImageMagick) could convert .eps files into .png files. The size of the png file can be controlled by the -density option.

This is really handy and makes the png plot in one press of enter.

[ Update 03/07/2012 ]
The 'convert' command is within the ImageMagick. With the update of ImageMagick to 6.7.5-10, extra arguments are required to create a PNG file with white background and smooth text.
convert -background white -alpha remove -density 150 plot.eps ${outputfile}
The default background for converting to PNG seems to be transparent in the latest ImageMagick (6.7.5-10). We need to remove the transparency (alpha) channel (-alpha remove), and assign the background to white (-background white).

[Python] Read data into array

This article is a follow-up of my previous perl script to manipulate data in a file. After I posted my question on a social website, I've received a lot of people encouraging me to do it in Python.

Some advantages of Python over Perl are: easier to maintain, easier for other people to read, and even google programmers use it. And there is claim out there saying that if you know C++, you could easily pick up Python. (Alright, I have to admit that the main reason is that googlers use it ..)

So I started learning Python and trying to write a Python script to do the same task:

  1. read in data from a file
  2. and store elements in arrays
  3. do simple calculations
  4. output result

In this Python script, it also takes input file name in the argument. First we need to import two modules:

   import os
   import sys
The os module allows us to work with files and directories. The sys module enables use to take arguments.

   filename = sys.argv[1]
As in C++, the first argument (argv[0]) is the name of your script. Here we assign the variable filename to our input file.

   lines = [line.strip() for line in open(filename).readlines()]
This statement reads in lines from the file, and strip off the spaces before and after each line. I personally found this command pretty intuitive. One thing I need to get used to is the use of for ... in . This is how for loop is used in Python, which is very different from C++. Now each of the lines in the file are stored in lines. To access each element in it:
   for i in lines:
       row = i.split()
       id.append(int(row[0]))
       y.append(float(row[1]))
The split() function split each elements into respective items (row[0] and row[1] in this case). The split() function can take delimiters, i.e. split('\t'). However I found it works the best just leaving it blank. The id and y arrays are used to store values in each column. We need to claim them before they are being used:
  id = []
  y  = []
The [] denotes empty array.

Once we have the values stored in arrays, we can easily manipulate them. To output the results, we could use the open function:

  output = open("output.txt",'w')
  for i in range(len(y))
        output.write("%2d\t %12f\n" %(id[i],y[i]))
  output.close
The % sign helps us output the format we want.

I might spend more time writing this Python script than I did my for perl one, but it is easier to follow. And also because the indent rules python requires, so the code looks more neat.

Hooray! My first Python code!!

[Perl] Read file and store data in arrays

I use c++ to do most of my analysis. Sometimes, I might want to do some small calculations on the results from c++, and it can be executed faster with a script. I've used bash script to get certain information in c++ output files. While bash script might be handy to use, it can only do integer arithmetic. I have two columns of data, in which I want to manipulate the values in the second column. After realizing that bash script wouldn't do floating-point calculation for me, perl became my next option. To be honest, I've never used it, never seen one single perl script before this evening. All the credits of my Perl script go to the forums on the web, and people who contributed to those threads. What I wanted to do is simple, but I found it is really hard to get a direct solution by googling around. I use pieces of instructions and examples from more than 10 webpages. My hope is that by putting together what I learnt tonight, newbies to Perl would understand how to:
  1. read in data from a file
  2. and store elements in arrays
  3. do simple calculations
  4. output result
Maybe the reason that there's no direct solution is that there's a much easier way out there than using Perl. But anyway, here's the script: Perl is similar to c++, one big difference is that for every variable, a "$" sign need to come before it. First ask user to input the file that will be read in:
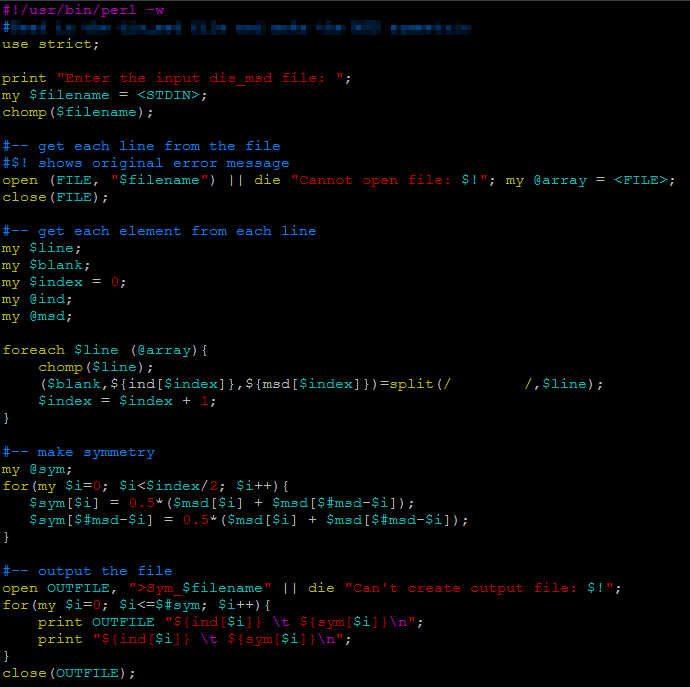
   print "Enter the input file: ";
   my $filename = <STDIN>;
my is used to declare a variable locally. With the use of "use strict", if we use a variable without defining it, Perl will show an error message. <STDIN> is what being typed by the user at the command prompt. It stands for standard input, and can be abbreviated by using simple <>. One thing you might already noticed is that unlike bash script, Perl requires a ";" at the end of a command, which is the same as c++.

After getting the input file name, we first read in each line of the file:
   open (FILE, "$filename") || die "Cannot open file: $!";
   my @array = <FILE>;
   close(FILE)

Each line in the file will be stored in the array. In Perl, an array is defined with a @ sign, and a scalar is defined with a $ in front of the variable name:
   my $line
line will be used to store one value.
   my @ind
ind will be used as an array.

Now that we have each line stored in array, we want to extract the elements and assign them to array @ind and @msd:
   foreach $line (@array){
          chomp($line);
         ($blank,${ind[$index]},${msd[$index]})=split(/        /,$line);
         $index = $index + 1;
   }
In the foreach loop, we first use chomp function to remove the newline character in the string. When reading data from user or from a file, usually there's a newline character at the end of the string. My input file looks like this:
        1        3.5555
        2        4.0233
        3        3.5099
        ..        .........
        ..        ..........

There's a huge blank space before the first column (it has to do with the way my c++ code output the results). The split function allows you to define what the deliminator is in each line of your array. I was able to store each column in respective array by storing part of the blank space in front in another variable $blank, which I had no intention to use afterwards.

After storing the data into those arrays, I can do calculations with those numbers.
If I would have a c++ code to do the same thing, it'd take me just a couple of minutes. But I like the convenience that scripting language could give me: execute the program without compiling it. Compiling a code meaning to add an addition executable file to the folder. If you have more than one executable, you need to name them in a reasonable fashion so that you know which one does which function. Usually, in this case I just recompile the code so that I'm certain the executable I'm using is the right one. Using scripting program not only reduces the number of files in the folder, but also eliminates the hassle of compiling codes.

Maybe the awk function could do this a lot easier than what I'm doing here. I'll try to expand my horizon to this field .... sometime when I finish my ChemE degree at Penn State.
Why computer simulations?

  • Simulations are relatively simple, inexpensive, and everything can be measured in principle.
  • Not to reproduce experimental results (exception: testing the accuracy of potentials)
  • Help to understand experimental results or to propose new experiments
  • Test of theoretical predictions or theories
  • Investigating systems on a level of detail which is not possible in real experiments or analytical theories (local structure, mechanics .., etc.)
  • Create new materials
Computer simulations often use an atomistic approach to find answers to interesting effect, technical problems, and theoretical predictions. At atomistic level simulation, particles interacting with each other is described by two methods:
ab initio calculation:
- positions of atoms -> electronic
- structure of the system -> potential
- computationally very expensive
Effective potential:
- Forms of potential is ad hoc.
- Parameters are obtained from fitting experimental data or restuls from ab initio calculations
- Cheap
The bottleneck for effective potentials (classical MD simulation) is about the time scale and accuracy of the potential, which have to be overcome so that the simulation can develop in their full capacity.

LAMMPS - A free open-source MD package

LAMMPS stands for "Large-scale Atomic/Molecular Massively Parallel Simulator", which is a molecular dynamics simulation package distributed by National Sandia Lab. LAMMPS incorporate MPI so it could run in parallel or on single processor.

The reason that I chose LAMMPS to simulate my ionomers for several reasons:

  1. It could run coarse-grained/united-atom simulations - LAMMPS includes many widely used empirical potentials.
  2. All codes are written in C++, so I am able to go into the code and do modification - the dihedral potential that I use for my ionomers are not included in the potentials LAMMPS provides. So I modified a similar potential in LAMMPS to describe the dihedral interactions.
  3. Maintained and developed by experts - This is the most important. LAMMPS has a newer version almost every year. Many new useful functions/features are added and useful force fields are incorporated. It also has an very active mail-list.

To keep LAMMPS a simple and fast simulator, LAMMPS does not help you post-process data. This is very different from other MD package like Gromacs or NAMD, which performs analyses of your simulation. Because it doesn't have a GUI interface, so LAMMPS won't visualize your simulation either. There are a few tools that allow you to do some pre/post-process, but I found it is much easier to do analyses in my own C++ codes.

To know more specifics about LAMMPS, the official website has all you need to know, and is always up-to-date.

Contact me

Mail me or stop by at:
   115 Fenske Lab
   Pennsylvania State University
   University Park, PA 16802

Call me at my office:
   (814) 863-2879

Or just email me:
   kxl281[at]psu.edu