 (About how to use Pizza.py, please refers to previous post of How to use Pizza.py for LAMMPS or the official Pizza.py Toolkit page.
Instead of asking pizza.py to get all the "Temp", "TotEng" .. by typing in each variable, and then do g.plot (a lot of repetitive keyboard work!), there's a much faster way to visualize the thermo-type data. It allows us to quickly view the trend of properties, and get an idea of the equilibrium status of the simulation.
This can be done directly on the shell or through pizza.py. Below is to do it in pizza.py:
(About how to use Pizza.py, please refers to previous post of How to use Pizza.py for LAMMPS or the official Pizza.py Toolkit page.
Instead of asking pizza.py to get all the "Temp", "TotEng" .. by typing in each variable, and then do g.plot (a lot of repetitive keyboard work!), there's a much faster way to visualize the thermo-type data. It allows us to quickly view the trend of properties, and get an idea of the equilibrium status of the simulation.
This can be done directly on the shell or through pizza.py. Below is to do it in pizza.py:
| $
python -i /home/pizza/src/pizza.py
|
First entering the pizza.py interactive interface. In the pizza.py interface, asking pizza to run the logview.py script:
|
Pizza.py (9 Feb 2012), a toolkit written in Python
type ? for help, CTRL-D to quit
Loading tools ...
>@run logview.py gnu log*
Executing file: /home/pizza/scripts/logview.py
200000
read 10001 log entries
|
Note that there's a "@" sign before
run. When Pizza.py was installed, the path to where the scripts are stored was also established (/home/pizza/scripts/). The third argument
gnu is to use Gnuplot to generate the graphs. Thus in this case, Gnuplot has to be installed in the machine as well. Last argument is the file name(s) where the thermo data are stored. It can be log* or can be multiple files, i.e. log.1 log.2 ..., etc.
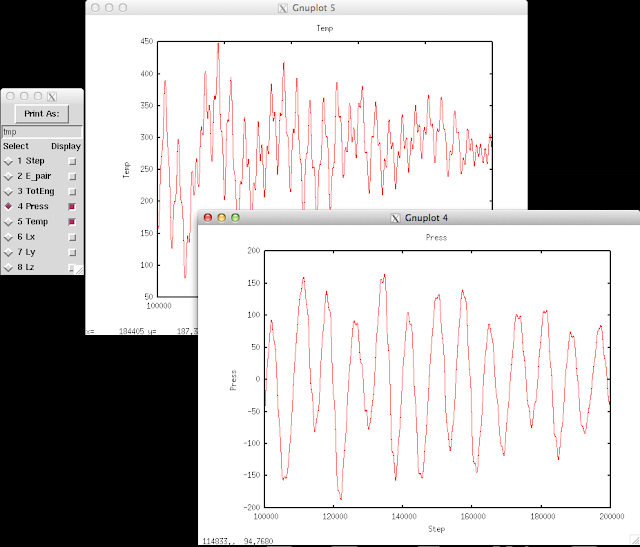
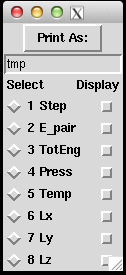
After loading the data, a panel containing the output thermo data appears (left hand size panel below). By toggling the
display options, the corresponding property vs. step will show up. The graph can be saved by first switch on the
select toggle next to the property (turning into red), and hit
print as. We can also change the file name from
"tmp" to a more informative one, such as
"Press". The saved graph will be in .eps format and locate at where you activate pizza.py.