Gnuplot with script
Posted on March 7, 2012, 2:51 PM
Gnuplot is a software in Linux machine that let you plot and fit your data. It has an interactive interface, or if you prefer, you can plot data with a script.
Here's an example of a script that plot a file in postscript, and convert it into png file:
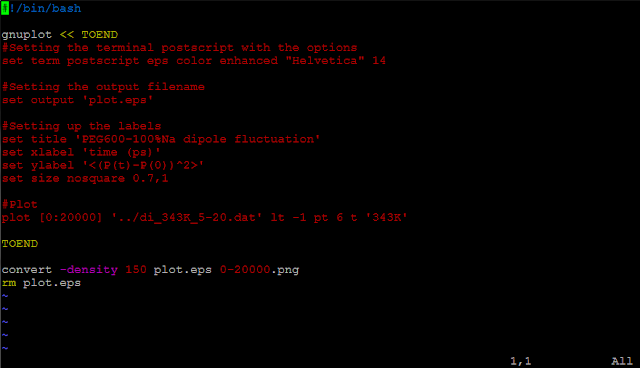 The communication with gnuplot is enclosed by the two "TOEND". In side the TOEND, type in all the commands that you'd like gnuplot to do for you. If you'd like to use linux command to manipulate your data, i.e. awk, you'll have to add "\" when you use the "$" sign. For example if I want to make the x values 1000 times smaller :
| plot "<awk '{print \$1/1000, \$2}' input_file" |
Otherwise, if you only have "$1", the compiler will think it is the variable of the script itself.
After create the image in postscript format, the convert command (ImageMagick) could convert .eps files into .png files. The size of the png file can be controlled by the -density option.
This is really handy and makes the png plot in one press of enter.
[ Update 03/07/2012 ]
The 'convert' command is within the ImageMagick. With the update of ImageMagick to 6.7.5-10, extra arguments are required to create a PNG file with white background and smooth text.
| convert -background white -alpha remove -density 150 plot.eps ${outputfile} |